1. The following table was extracted from a report to be delivered to the community by the district health officer in your area about malaria epidemic.
The table shows reported cases of malaria and malaria related deaths in the area from January to June.
|
Month |
Reported Cases |
Related deaths |
|
January |
80 |
04 |
|
February |
100 |
05 |
|
March |
98 |
01 |
|
April |
87 |
03 |
|
May |
70 |
02 |
|
June |
60 |
01 |
You have been entrusted with the task of preparing a five-slide presentation on the epidemic
a) Make a five-slide presentation for the workshop as follows;
i) SLIDE 1: Should include the title and name of the presenter. Insert a hyperlink to the presenter’s personal website.
ii) SLIDE 2: Insert the given table. Include a slide title.
iii) SLIDE 3: Use the information in the table to create a column chart.
iv) SLIDE 4: sShould include ways of preventing malaria.
v) SLIDE 5: Conclusion
b) Each slide should;
- Have your name and personal number as a header
- Run every after one minute
- Have minimal and appropriate graphics
c) Save the presentation as your name and personal number.
d) Print your slides
2 a) Using any web designing software, design a website for a public library with the following linked pages:
i) HOME PAGE including a marquee
ii) CONTACT US PAGE including the location, postal address, telephone number and email address of the library
iii) LIST OF BOOKS available in the library
iv) BOARD OF GOVERNORS PAGE showing the management committee of the library.
v) FUTURE PLANS
b) The website should have a top banner.
c) Use relevant images where possible
d) Save your website as Library and your name e.g Library_Musoke
e) Print your work
3. The table below shows the details of some musicians in Uganda.
|
Artist Number |
Real name |
Stage Name |
Sex |
Date of Birth |
Music Category |
Best Hit |
Home Town |
Stage worth $ |
|
M001 |
Musoke |
Miad Tiger |
Male |
02/03/1980 |
Ragga |
Omukwano |
Kampala |
100,000 |
|
M002 |
Ojok |
Big boss |
Male |
01/01/1975 |
Country |
Uganda my homeland |
Gulu |
50,000 |
|
M003 |
Namusoke |
Snake Girl |
Female |
01/06/1985 |
Dance Hall |
Sleeping Pill |
Masaka |
120,000 |
|
M004 |
Magumba |
DJ Best |
Male |
03/05/1988 |
RnB |
Dissappointment |
Kampala |
600,000 |
|
M005 |
Baguma |
Mr. Right |
Male |
03/01/1990 |
Ragga |
Good girl |
Jinja |
50,000 |
a) Using any database management software, create a database and save it as Musician your name e.g Musician Amooti.
b) Design a table to capture the given data using appropriate data types of the fields. Name it Musician Table
c) Create a form called Entry Form to enter the data
d) Create a query called Tax query to calculate the tax paid by the artists. The tax is 10% of the Stage Worth
e) Create another query showing artists born before 1986 and whose home town is Kampala. Name it Kampala Artists.
f) Create a report using the Kampala Artists query and name it Kampala Artists report.
g) Print all your work in landscape orientation.
4. a) Using a word processor, type the following document. Save it as your name and personal number.
Mathematics is a subject that is taught in schools at all levels right from pre-primary to institutions of higher learning. The subject is relevant in many fields of study. Given below are examples of an equation and a diagram in mathematics.
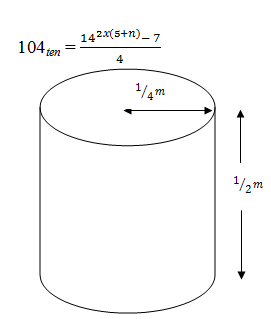
Such calculations and other related concepts make Mathematics a very exciting subject!
ii) Copy the document and paste it to a new page
iii) Insert a suitable heading for the document. Centre and underline the heading.
iv) Drop Cap the first paragraph.
v) Italicize the last sentence
vi) Insert a header of your name and personal number
vii) Add page numbers in the document
viii) Save and print all your work
b) The table below shows a quotation by Ms JM Enterprises, dealers in foodstuffs.
|
MS J M ENTERPRISES |
||||
|
DEALERS IN GENERAL FOOD STUFFS |
||||
|
QUOTATION |
||||
|
SERIAL NUMBER |
ITEM |
QUANTITY (KGs) |
UNIT PRICE (UgX) |
TOTAL (Ugx) |
|
1 |
Maize |
2 |
2,400 |
|
|
2 |
Beans |
5 |
3,000 |
|
|
3 |
Peas |
10 |
1,500 |
|
|
4 |
Cassava |
6 |
2,000 |
|
|
5 |
Lemon |
3 |
1,200 |
|
|
6 |
Sugar |
20 |
2,500 |
|
|
7 |
Matooke |
4 |
15,000 |
|
|
8 |
Groundnuts |
4 |
6,000 |
|
|
9 |
Passion Fruits |
2 |
4,000 |
|
|
10 |
Meat |
5 |
4,500 |
|
|
GRAND TOTAL |
||||
|
VAT (17.5%) |
||||
i) Use a spread sheet software to enter the given data as it is. Save it as your name and personal number.
ii) Insert formulas to calculate the TOTAL and GRAND TOTAL.
iii) Calculate the Value Added Tax (VAT) at a rate of 17.5%.
iv) Sort your data by ITEM in ascending order.
v) Apply All Borders on your work.
vi) Represent the items and their unit prices on a Pie Chart.
vii) Save and print your work.